
Traders See a $30K Bitcoin Risk. Miners See a Different Signal.
Bitcoin price is back near one of those levels traders love to argue about.
According to the original report, BTC has returned to its 200-week moving average for the first time since 2023. That puts one of Bitcoin’s most watched long-term technical levels back in the center of the conversation. Some analysts see the area as a possible bottom zone. Others think a deeper move is still on the table, with the $30,000 range showing up again as an extreme downside target.
That kind of headline works because it hits the right nerve.
$30,000 sounds dramatic. The Bitcoin 200-week moving average sounds serious. A chart that reminds people of old bear-market levels is exactly the sort of thing that makes crypto timelines nervous.
But the real question is not whether one line on a chart can “save” Bitcoin.
The better question is what that line tells us, and what it does not.
The 200-Week Average Matters. It Still Is Not Magic.
The Bitcoin 200-week moving average has earned its reputation.
In past Bitcoin market cycle lows, it has often appeared near moments when fear was high, leverage had been flushed, and long-term buyers started paying attention again. That history gives the level weight. Traders do not watch it for no reason.
But the line itself does not create demand.
It does not fix liquidity. It does not stop forced selling. It does not guarantee that sellers are done. It is a tool, not a law of nature.
This is where a lot of BTC price analysis gets sloppy. A historically important level becomes a certainty machine. People start treating the 200-week moving average like a switch: touch it, bounce; lose it, disaster.
Markets rarely behave that cleanly.
The level matters because traders believe it matters. That belief can affect short-term behavior. But psychological support is not the same as structural support. If liquidity is thin, leverage is unwinding, or macro pressure is strong enough, even a famous moving average can fail.
$30,000 Is a Fear Target, Not the Current Fact
The $30,000 number is useful because it shows how quickly sentiment stretches during stress.
When Bitcoin price trades around a major long-term moving average, people do not just ask whether support holds. They start building the next fear map. What happens if this level breaks? What happens if the old cycle structure fails? What happens if Bitcoin revisits areas most people thought were gone?
Those are fair questions.
But a risk scenario is not the same thing as the current fact.
Bitcoin moving near the 200-week moving average does not automatically mean BTC is heading to $30,000. It means traders are watching a level where failure could open the door to more aggressive downside targets.
That distinction matters, especially for people who are not professional traders.
A headline can make a scenario feel like a forecast. A chart can make an extreme target feel closer than it is. Crypto does this all the time. The market takes a technical possibility, wraps it in panic, and treats it like destiny.
The downside risk may be real. But risk should be treated as risk, not certainty.
Price Support Is Not the Same as Miner Pressure
Another mistake happens whenever Bitcoin sells off: people start mixing every bearish explanation into one big story.
Weak chart. ETF flows. Macro pressure. Exchange deposits. Bitcoin miner inflows. Bitcoin miner selling pressure. Someone sees “Bitcoin miners Binance” in a dashboard or headline, and suddenly the whole move gets blamed on miners.
Sometimes miner behavior matters. Of course it does.
When margins tighten, less efficient miners feel it first. Power costs, debt, difficulty, machine efficiency, uptime, and transaction fees all start to matter more. Bitcoin mining pressure is real when operating economics become uncomfortable.
But a chart testing Bitcoin price support is not automatically proof of miner capitulation.
A technical level can break without miners being the main driver. Miner-related exchange activity can show movement without proving immediate market selling. And not every red candle needs a neat villain.
This is why mining analysis has to stay grounded. Bitcoin miners are part of the market, but they are not a universal explanation for every ugly candle.
Traders Watch the Line. Miners Watch the Network.
For traders, the 200-week moving average is a clean reference point. It gives them a level to defend, lose, reclaim, or short against. That is how trading works.
For miners, the view is different.
A Bitcoin miner does not operate because a moving average is holding. It operates because power is available, cooling works, firmware runs, pools respond, blocks keep arriving, and the hardware can keep producing hashes.
That is why Bitcoin mining gives a useful second lens during price panic.
The chart can look terrible while the network continues to function. Price can fall while blocks keep coming. Analysts can argue over whether Bitcoin is entering a new bear-market phase while miners continue doing the physical work of Proof of Work.
These systems are connected, but they are not the same system.
Price affects mining economics. No serious miner ignores it. But price stress is not network failure.
A technical breakdown is one signal. The continued operation of Bitcoin mining hardware is another.
Home Mining Makes Bitcoin Less Abstract
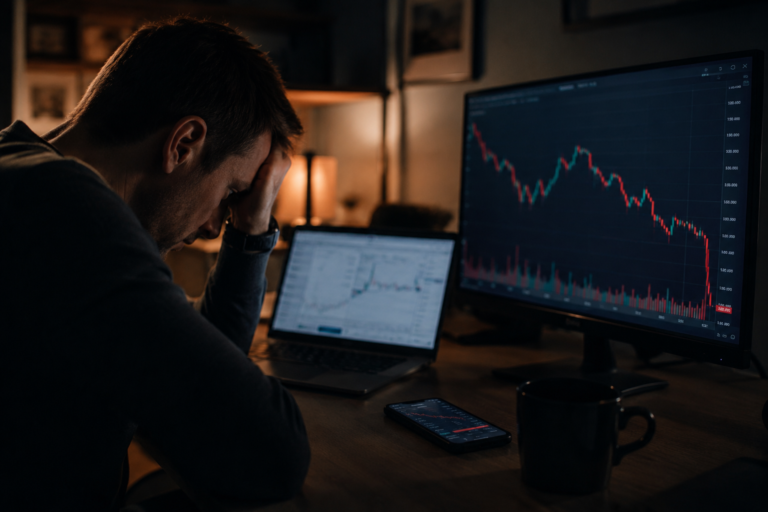
Most people experience Bitcoin as a number on a screen.
They watch the price. They read the headline. They refresh the chart. If BTC falls hard enough, their entire understanding of Bitcoin becomes the red candle in front of them.
Bitcoin home mining changes that perspective.
A small home Bitcoin mining setup does not make someone immune to volatility. It does not turn Bitcoin into predictable income. It does not remove drawdown risk.
What it does is make the network physical.
A Bitcoin miner shows power becoming hashrate. It shows heat, airflow, firmware, pool configuration, uptime, and probability. It turns Bitcoin from a ticker into something you can hear, measure, configure, and troubleshoot.
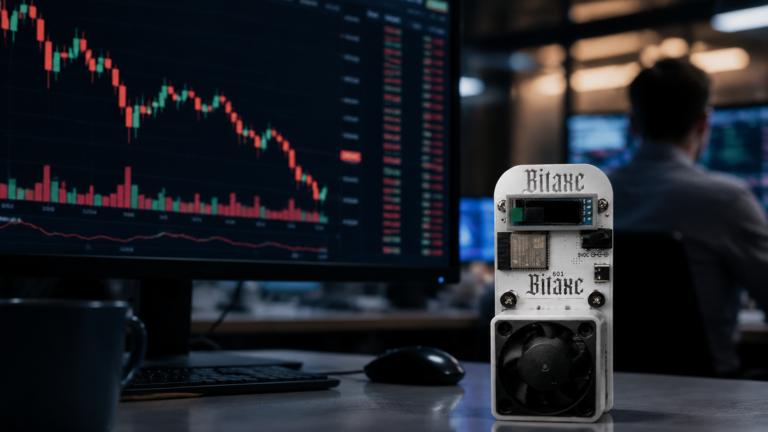
That is especially true with small Bitcoin mining hardware like a Bitaxe miner. It is not trying to compete with industrial farms. It is not supposed to replace large-scale miners with cheap power and professional operations. Its value is different. It helps people understand what mining actually is.
For many home Bitcoin mining users, that learning process is the point.
They start seeing Bitcoin as a working network, not just a market symbol. They learn that solo mining is probabilistic. They learn that rewards are never guaranteed. They learn that hardware is honest in a way charts are not. A unit runs or it does not. The setup works or it does not. Hashrate appears or it does not.
That kind of feedback is hard to get from a price chart.
SoloBitaxe fits into that home Bitcoin mining conversation as one example of how small miners can make Proof of Work visible to normal users. Not as a shortcut around market risk. Not as a promise. Just as hardware connected to the network.
The Cycle Debate Is Only One Layer
Bitcoin market cycle analysis is not useless.
The 200-week moving average, prior bear-market structures, drawdown levels, and historical support zones all help traders frame risk. A trader who ignores those levels is probably being careless.
But they do not explain all of Bitcoin.
They explain the market layer.
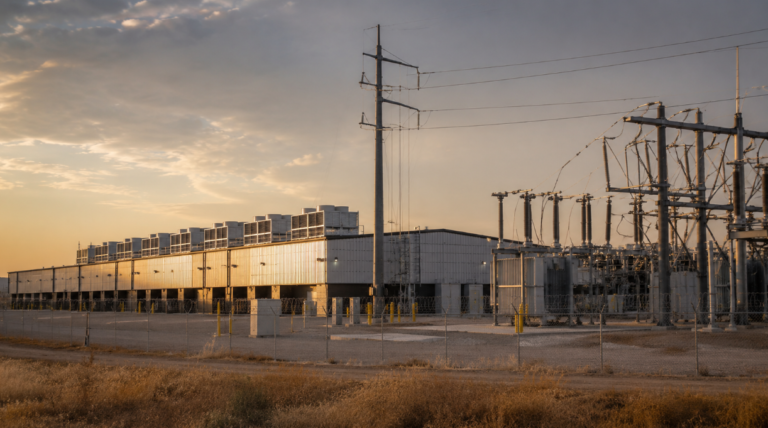
Bitcoin also has a network layer. That layer is slower, less dramatic, and less friendly to headlines. It is made of nodes, miners, hardware, energy, incentives, and time.
That is why the mining perspective is useful when the market gets loud.
If Bitcoin falls, traders will ask where the next support level sits. If Bitcoin bounces, they will ask whether the recovery is real. If Bitcoin breaks the 200-week moving average cleanly, the $30,000 debate will get louder.
Those are market questions.
The mining question is simpler.
Is the network still producing blocks under pressure?
If the answer is yes, the chart is not the whole story. It is just the loudest one.
A Better Way to Read Bitcoin Stress
The mistake is not watching price. Price matters.
It affects miners, buyers, manufacturers, treasuries, and market confidence. Anyone pretending otherwise is just performing.
The mistake is treating price as the only proof that Bitcoin is working.
A 200-week moving average retest can signal stress. It can mark opportunity. It can fail. It can become a level that people argue about for weeks.
But Bitcoin does not become more or less real because one moving average holds or breaks.
For traders, the next battle may be the 200-week line.
For miners, the test has not changed.
The network has to keep running.